


VISUALIZZAZIONE "LISCA DI PESCE" E "STORICO-PREVISTI"
In qualunque momento è possibile analizzare quanto previsto dai modelli idrologici e idraulici nel passato attraverso l'utilizzo di due funzionalità grafiche:
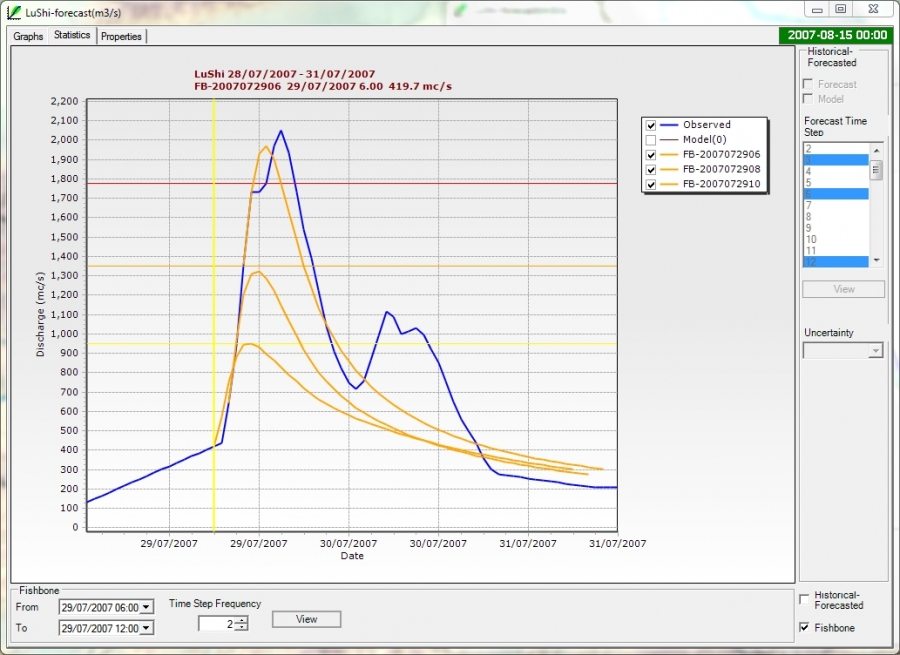
- il grafico "a lisca di pesce" consente di visualizzare tutte le previsioni fatte dall'insieme dei modelli idrologico o idraulico in un punto, per un periodo di tempo definito dall'utente. Questo tipo di analisi è utile per analizzare il comportamento del modello matematico e per valutare la successione delle previsioni ottenute in tempo reale.
- il grafico "storici-previsti" mostra le serie temporali ottenute collegando tra loro tutti i punti con lo stesso orizzonte di previsione (ad es. 6 ore) ottenuti da ciascuna previsione del modello. Questo tipo di visualizzazione consente di valutare, in fase post evento, lo scadimento delle capacità di previsione del modello con l'aumentare dell'orizzonte di previsione. Inoltre consente di valutare anche l'efficacia delle previsioni meteorologiche utilizzate come input al modello matematico grazie al confronto tra la serie storica delle previsioni ed il run ottenuto alimentando il modello con i dati di precipitazione e temperatura osservati.
VISUALIZZAZIONE MULTI-FINESTRA
La piattaforma EFFORTS consente di visualizzare, anche contemporaneamente, più finestre contenti dati storici, dati in tempo reale e previsioni dei modelli di calcolo. Le finestre di tempo reale e le finestre con le previsioni dei modelli di calcolo si aggiornano automaticamente ogni volta che un nuovo dato si rende disponibile.
Il tipo, dimensione e posizione delle finestre visualizzate può essere salvato sotto forma di configurazione. Inoltre è possibile:
- Ricaricare la configurazione salvata con il riferimento temporale attuale della piattaforma, ad es per monitorare lo stesso gruppo di stazioni e/o punti di previsione durante il corso di un evento evento;
- Ricaricare la configurazione salvata con il riferimento temporale della piattaforma al momento del salvataggio, ad es. per mostrare una situazione osservata durante il monitoraggio in tempo reale ad un altro operatore in un momento successivo.

ANALISI DEI RISULTATI DEL MODELLO IDRAULICO: PROFILO DEL FIUME E SEZIONI
Al fine di analizzare le previsioni effettuate dal modello idraulico, la piattaforma EFFORTS dispone di una finestra di visualizzazione del profilo longitudinale del corso d'acqua. La finestra visualizza:
- il profilo del corso d'acqua con indicato il livello dell'acqua, gli argini golenali, gli argini maestri, i punti di confluenza dei rami laterali, i punti di interesse o riferimento
- il profilo delle portate lungo il corso d'acqua
- le sezioni trasversali utilizzate dal modello idraulico per la simulazione lungo il corso d'acqua
La finestra di visualizzazione del profilo consente di analizzare dati e previsioni nel tempo e nello spazio. E' infatti possibile fissare un instante di previsione e scorrere sezione per sezione il corso d'acqua per analizzare la situazione, oppure è possibile fissare una sezione di interesse ed analizzare l'andamento del livello d'acqua nel tempo.
VISUALIZZAZIONE DATI STORICI DAL DATABASE IDRO-METEOROLOGICO

INTERROGAZIONE DEL DATABASE IDRO-METEOROLOGICO
La piattaforma EFFORTS può essere utilizzata per visualizzare i dati contenuti all'interno del database idro-meteorologico.
Le stazioni e i dati di interesse possono essere selezionati utilizzando filtri sulle caratteristiche (nome, appartenenza ad un bacino idrografico, comune, provincia e regione di appartenenza, ecc.). E' possibile selezionare se visualizzare i dati misurati o i dati campionati.
I dati possono essere esportati in formato "csv" ed ASCII.
VISUALIZZAZIONE DEI DATI STORICI
Per ciascun tipo di sensore è possibile avere accesso ai dati storici direttamente dalle finestre di visualizzazione dei dati in tepo reale.
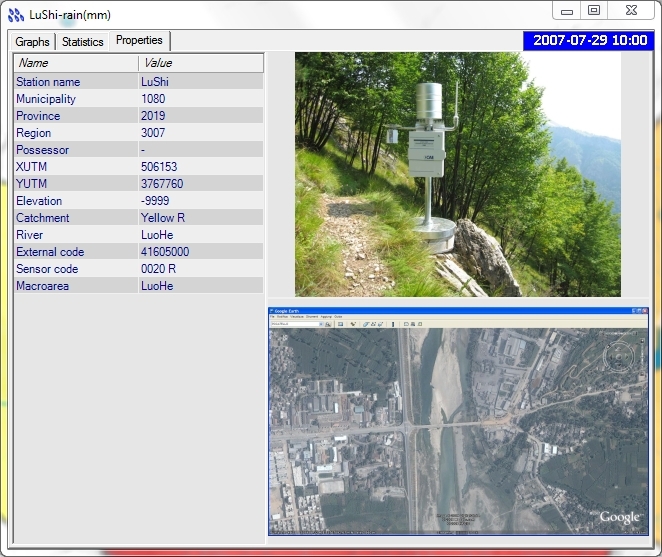
La scheda statistiche consente di visualizzare i dati storici contenuti all'interno del database idro-meteorologico. A seconda del tipo di sensore, le seguenti informazioni vengono visualizzate all'interno della finestra:
- Istogrammi
- Serie temporali
- Tabelle con i valori dei dati campionati
- Tabelle con il valore massimo cumulato per differenti intervalli di tempo (1, 3, 6, 12, 24 e 48 ore)
- Statistiche (minimo, massimo e valore medio per ogni giorno, mese e anno)